Revamping the NFL Playoff System
Summary
In the NFL, having more wins than a team doesn’t necessarily mean that you get a better playoff spot than them. And in cases where two teams have the same number of wins, tiebreakers can seem arbitrary and not very informative. Here, I set out to create a better metric for NFL team’s success in a season. I propose a model similar to the NCAA’s RPI, based off of the circumstances surrounding a team’s wins and the team’s strength of schedule. After justifying and developing my model, I analyze two historical years to identify how this change would have altered past playoffs.
Note: Data used for this analysis includes all seasons from 2002-2019. Team names used are the names that were accurate as of June 2020. Names or locations that have since changed have not been altered.
Note: Data used for this analysis includes all seasons from 2002-2019. Team names used are the names that were accurate as of June 2020. Names or locations that have since changed have not been altered.
I. Introduction
Playoffs? You want to talk about playoffs? Vic Fangio, head coach of the Denver Broncos, sure does1. Fangio has proposed a radical idea for the NFL: abolish divisions and forget the wild card. Everyone in each conferences plays each other once, and the top 6 teams make the playoffs. Fangio’s biggest concern is one that NFL fans have grumbled about for a long time: a worse team hosting a better team in the wild card. This year, this manifested as the 9-7 Eagles (4th seed) hosting the 11-5 Seahawks (5th seed). Even the 6th seeded Vikings at 10-6 boasted a better record than the Eagles. Under Fangio’s proposed system, we would rearrange the NFC playoffs like this:
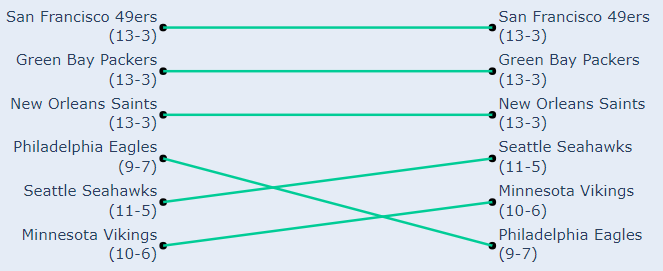
Now on wildcard weekend, the Eagles travel to New Orleans and the Seahawks host the Vikings. Are these better matchups? If you’re a Saints fan, you’re probably happier. After losing to the Vikings in overtime, it seems likely that the Saints could have beaten a slightly worse opponent in the Eagles. Eagles fans meanwhile might be upset about having to travel, but home field advantage didn’t really help them anyway. Overall, I think this is a better playoff picture. Teams are better rewarded for their season: the Saints get an easier matchup and the Seahawks get home field advantage, while the Eagles just squeak in.
Before we go and revamp the playoffs, we should see if this is really a problem. How often do teams have better records and worse seeds? The top four are automatically sorted by record, as are the bottom two, so we just need to look at the wild card teams vs. the division winners. Here’s every wild card team since 2002 when the NFL last updated its playoff structure.
Logos obtained from sportslogos.net. See note about logo usage.
You can click on any team above to focus on just your favorite. The color of the shape indicates how angry each team’s fans should be. Blue means that team was fairly placed (ignoring tie breakers for now). Red means a wildcard team had a strictly better record than a division winner. Ties are counted as 0.5 wins. The darker the red, the more division teams the wildcard team bested. So, for example, the 2018 5th-seeded Chargers had a better record than 3 of the 4 division winners and still had to travel (and even play) on wildcard weekend. Thus, they show as 5/3. In total, 36 wildcard teams have been cheated out of a better spot since 2002. That’s 2 of the 4 wildcard teams per year, on average. The biggest losers are the Packers, Colts, Steelers, and Seahawks, who have bested at least one division winner in 12 of their collective 15 wildcard appearances.
Let’s fix this. From now on, we take the top six teams. Using the standard division winner rules, this would look something like this:
1. Take winner from each division, using tiebreakers as necessary
2. Take top two records from remaining teams, using tiebreakers as necessary
3. Order these six teams by record
2. Take top two records from remaining teams, using tiebreakers as necessary
3. Order these six teams by record
This still presents a problem. What if a team misses the playoffs despite being better than a division winner because they are worse than the two wildcards? This has happened before, most recently in 2015:
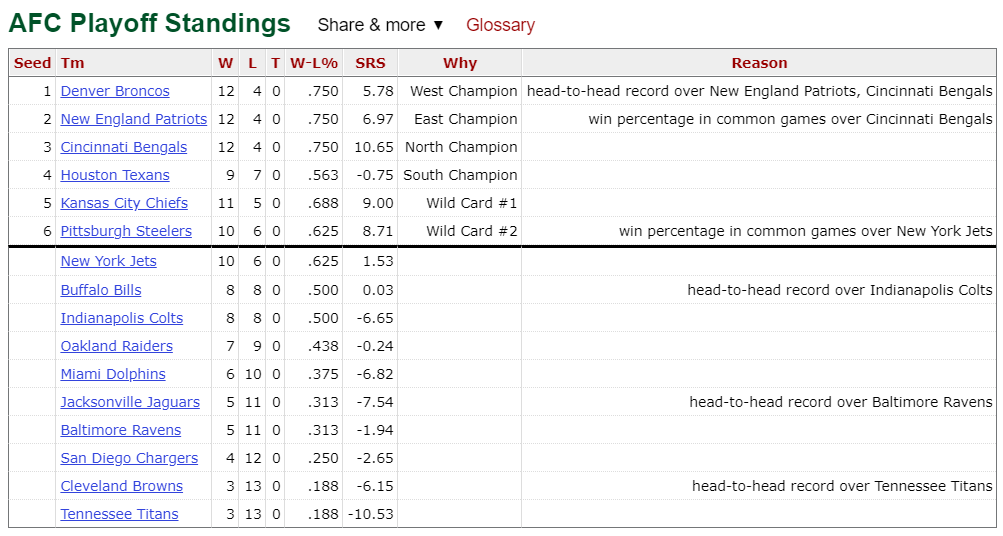
Credit Pro Football Reference
The 10-6 Jets missed the playoffs while the 9-7 Texans got in. To fix this, we can just take the top 6 teams from each conference. Now, the 2015 Jets get in and the Texans go home early. One of the potential problems with this is strength of schedule. If we are just taking the six best teams, then a team with a softer division gets a huge lead over a team with a more competitive one. To look at relative strength of a division, we can look at how many more wins each division gets compared to the average. On average, a division will have 32 wins (each team going 8-8). Here is how many more wins each division racked up for each year since 2002:
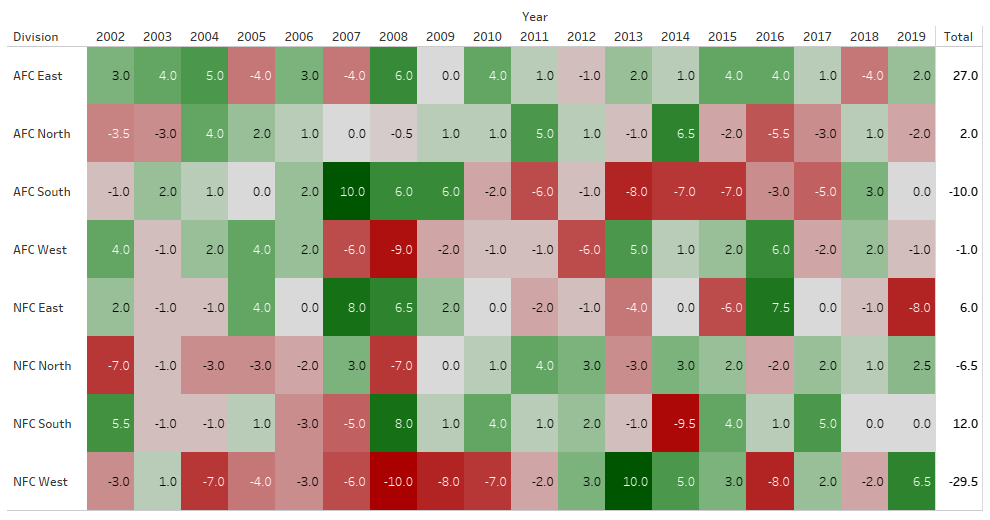
We see that the AFC East has more wins than the rest of the league. However, this doesn’t mean the AFC East is better than the rest of the league: the Patriots represent 221 (37%) of the AFC East’s 603 wins since 2002. On average, we would expect a team to win 144 games over this span (8 games per year). The Jets, Dolphins, and Bills all fall short of this mark at 129, 127, and 126, respectively. This suggests that the Patriots have a huge advantage by being in the East, a feeling that many people have expressed and analyzed over the years2,3. For a little more context, here is how every team has fared in divisional games (playoffs excluded) since the 2002 expansion:
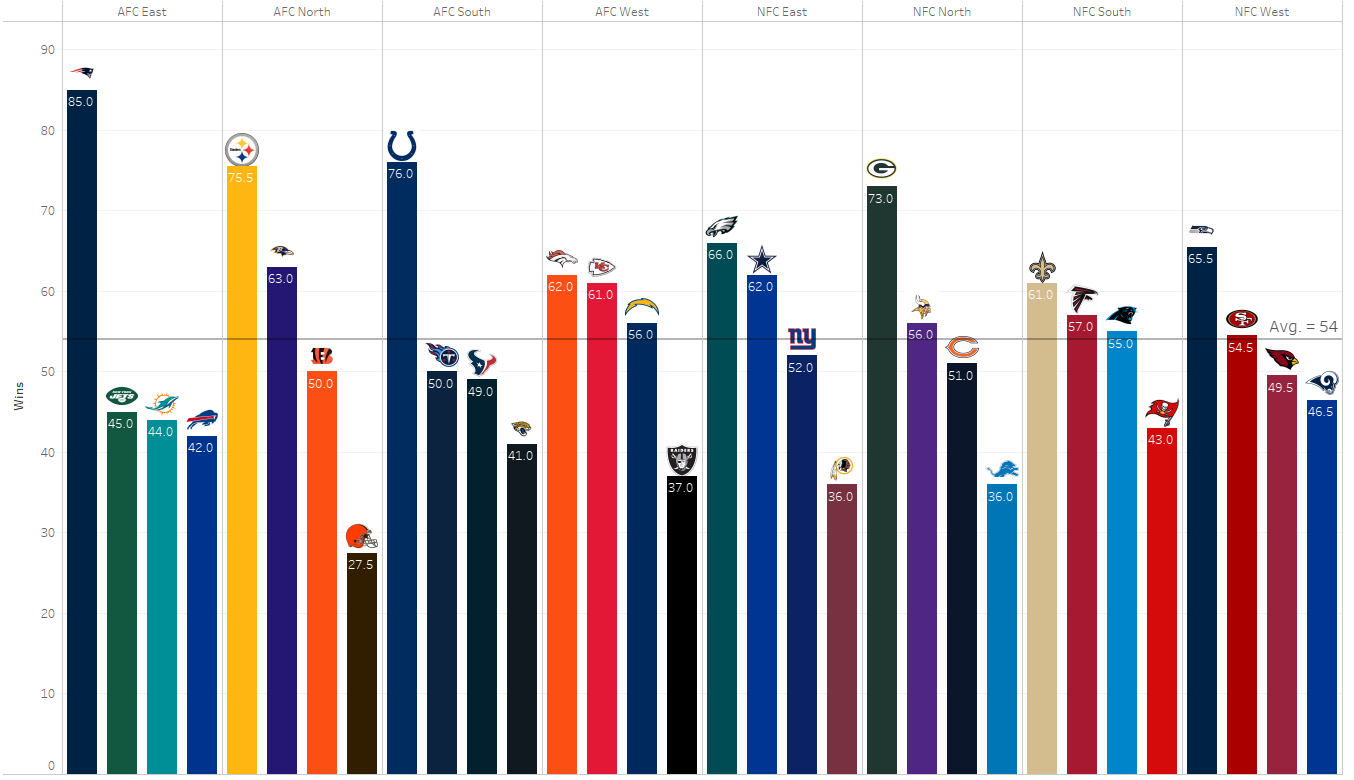
Clearly, some teams have played better in their division (NE, PIT, and IND) than others (CLE, WAS, DET). The big question, though, is "is this a result of easy/hard divisions or simply a reflection of the quality of these teams?". Patriots Insider Tom Curran thinks that it’s more a representation of how good or bad teams are overall, at least in the case of the Patriots 4. Others, like Neil Greenberg of the Washington Post 5, argue that while better teams should be better, having a soft schedule doesn’t hurt, especially when a powerhouse like the Patriots or Steelers gets two games per year against teams that have tended to be bad like the Jets or the Browns. I tend to agree more with Greenberg; even if teams earn all of their divisional wins, winning the NFC South has definitely meant more than winning the AFC East in recent years. Additionally, strength of schedule is compiled every year, and inevitably one team has a far easier schedule than others. In 2019, both the Packers and Forty-Niners went 13-3, but the Packers had an average opponent win percentage of 0.483 while San Francisco faced teams that average 0.534. This corresponds to the 11th easiest and 5th hardest schedules, respectively.
This difference is small but not negligible; in 2019, the Packers played the (3-13) Lions twice while the 49ers played the (9-7) Rams twice. If we replaced both of the Packers games against the Lions with two games against the Rams, we bring the Packers strength of schedule up to 0.534. In real life, the Packers took both games over the Lions; if they were to lose one of their games against the much better Rams, they would have dropped to third in the playoffs and played the Vikings on wildcard weekend while the Saints stayed home. This evidence is definitely anecdotal and speculative; the Packers may have beaten the Rams twice and nothing would have changed. Either way, I’m convinced a team’s schedule is important enough to be included in my playoff metric.
So what’s the best way to account for a team’s schedule? Under Fangio’s proposed system1, there’s nothing to worry about. Every team in a conference plays everyone else in their conference once, so records are directly comparable. It gets a little hazier if we include one cross-conference rivalry game or if the NFL decides it likes its current scheduling procedure. In these cases, I think the best bet is to look at the NCAA’s RPI. The RPI (Ratings Percentage Index) attempts to include opponents and home-field advantage in the ranking of teams. This allows for comparison against teams that haven’t played each other as well as rewarding more “challenging” wins. I also want to include a factor for scoring. I think it’s justified to say that a team winning 40-0 over team X is more likely to beat a team that beat team X 3-0 and thus should be ranked higher. And with only 16 regular season games, the extra data might help to differentiate comparable teams and avoid those annoying tiebreaker situations we saw earlier. Now, my metric (I'll simply call it Points) is something like this:
$$Points = w_1 * Win\%_{Adj.}+w_2 * Win\%_{Opp.} + w_3 * Win\%_{Opp.'s\ Opp.}$$
where $w_1$, $w_2$, and $w_3$ are weights for each of the variables. So how should all of these adjustments and weightings be defined? Let's start with win percentage.
II. Win Percentage
To start, we will say that a team only gains points for winning (losing doesn't affect your points).
As previously mentioned, home and away need to be factored into wins. We also want to include the “quality” of the win, i.e. whether it was a blowout or a close game. First, let’s define our home-field advantage. In the NCAA uses 1.4X and 0.6X multiplies for home losses/road wins and home wins/road losses, respectively.Note Rather than just take these at face value, let’s see how much more likely a team has been to win at home since 2002:
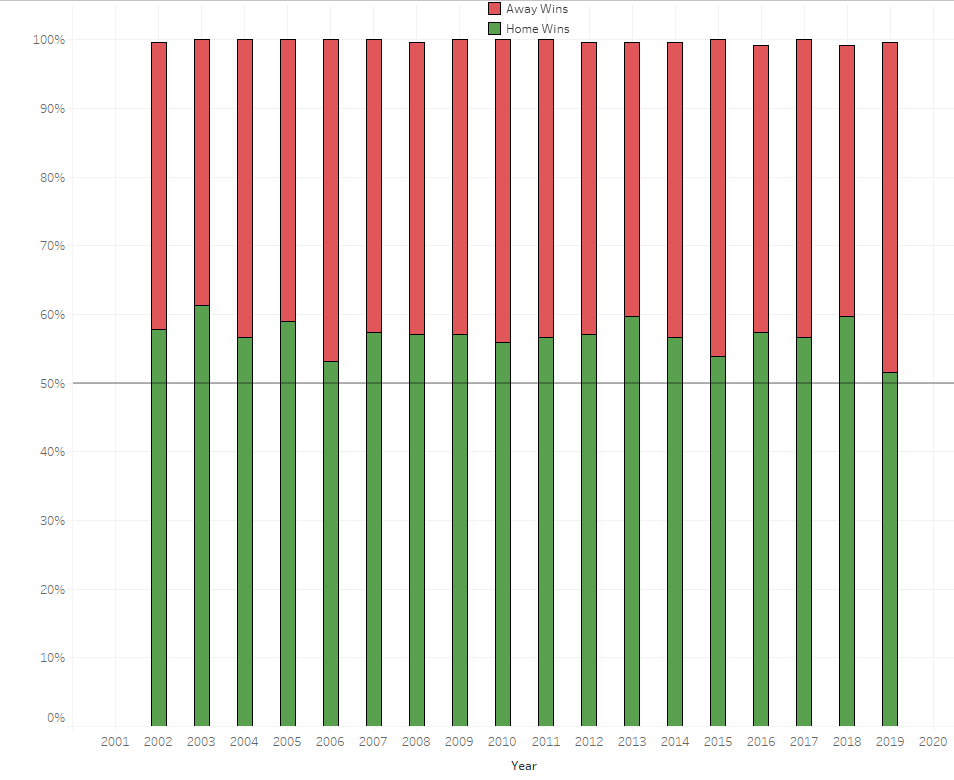
Since 2002, the home team has won, on average, 57% of the time (excluding playoffs). That means that we expect a team to win 4.6 of their home games per year and only 3.4 road games. These should each be worth the same number of points ($p$), so $$p=4.6*(1-x)$$ $$p=3.4*(1+x)$$ Setting these equal, we get x = 0.15. So if a team gets a win at home, they get 0.85 points, whereas if they get a win on the road they get 1.15 points.
What about ties? Ties are pretty infrequent and thus shouldn’t affect our results too much, but for simplicity we’ll say ties are worth half as much as a win would be. Therefore, a home win gets you 0.475 points while a road win gets you 0.575 points. As a quick note, even with margin of victory adjustments (next section), there is no way for a win of any kind to be worth less than a tie.
III. Margin of Victory
Next, we have to account for margin of victory. This gets complicated because a team winning by a certain margin doesn’t always mean the same thing about the game. For example, a team winning by double digits can be a blowout or a close game, depending on when those points were scored. If Team X leads Team Y by 17 with 1 minute left and Team Y gets a garbage time touchdown, that’s a 10 point margin of victory. If Team X leads Team Y by 3 with 1 minute left and returns a desperation toss up for a pick six, that’s still a 10 point margin of victory. In the first scenario, Team Y had virtually no chance of winning; in the second, one play could have changed the outcome of the game. I initially started out by looking at a wide range of factors, from margin of victory to number of lead changes to largest lead/deficit to adjust the margin of victory. This analysis is available here if you're interested. To move on, I have to spoil the results: average lead (AL) by itself serves as a good proxy for adjusted margin of victory. Average lead is exactly what it sounds like: if the eventual winner trails by 3 points for half of the game and leads by 3 for the other half, they would have an AL of 0. A game where one team jumps out from the beginning and crushes their opponent has a large AL, while a back and forth game has an AL near 0. Since AL is calculated from the winner's perspecitve, a comeback win may have an AL below 0. The lowest AL in my database was -15.6 when the Bills blew a game against the Dolphins on 12/4/2005 . Score after 1 quarter: 0-21. Final score: 24-23. The largest AL was 32.4 when the Falcons blew out of the Buccaneers, 56-14 on 9/18/2014.
So how do we apply AL to get an adjustment? ALs around or below 0 should result in a slight deduction – they could’ve gone the other way pretty easily. Games with large ALs should get a bonus, as they weren’t just wins, they were definitive wins. The AL curve for the 4,598 games from 2002-2019 with a winner looks like this:
So how do we apply AL to get an adjustment? ALs around or below 0 should result in a slight deduction – they could’ve gone the other way pretty easily. Games with large ALs should get a bonus, as they weren’t just wins, they were definitive wins. The AL curve for the 4,598 games from 2002-2019 with a winner looks like this:
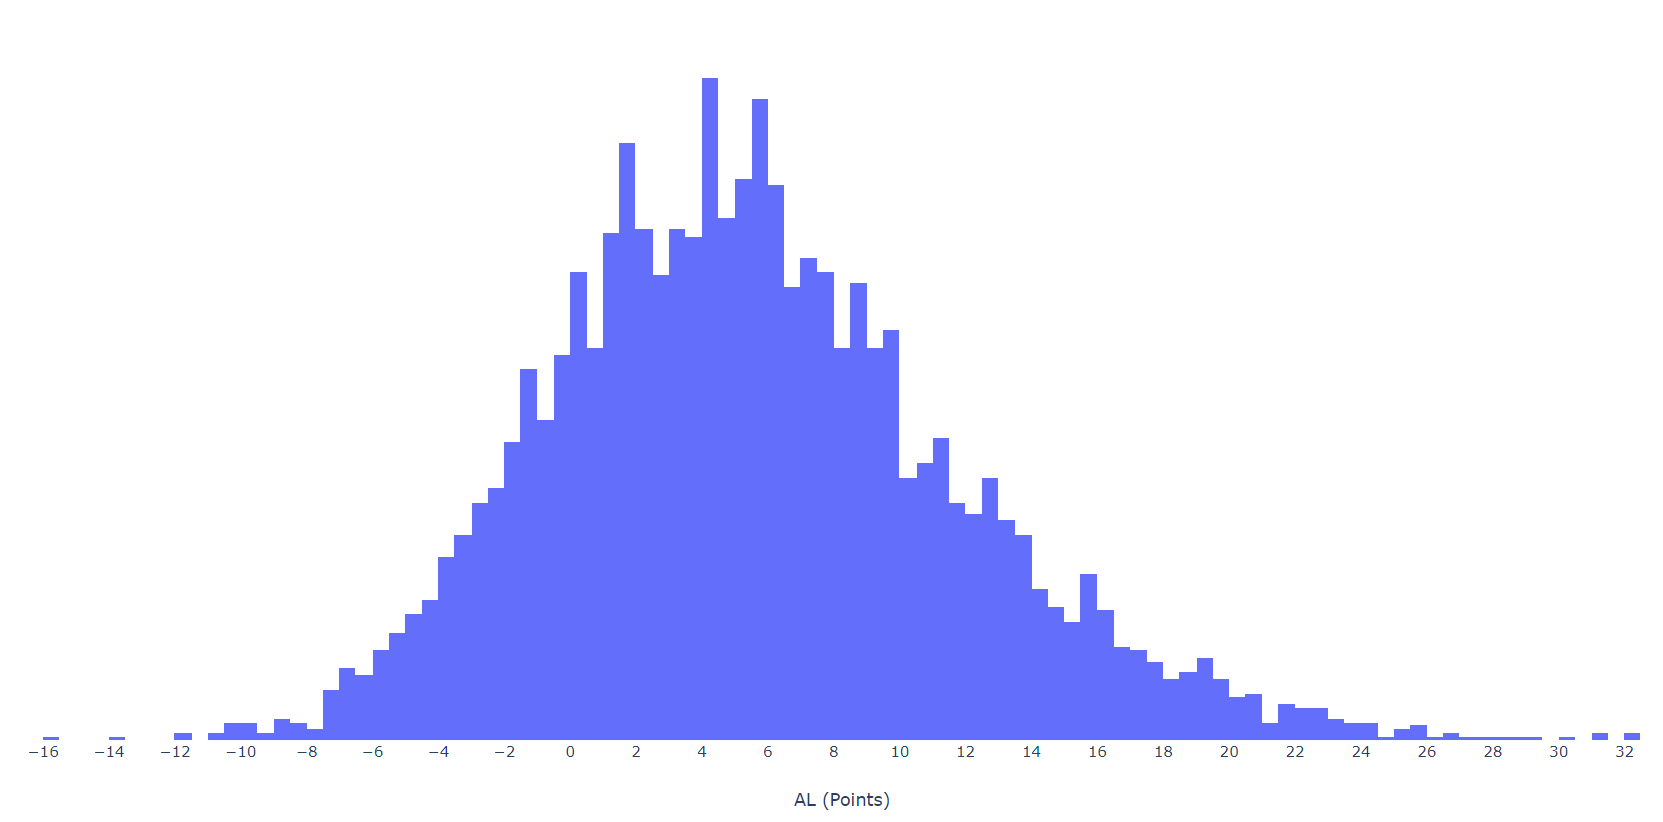
This is a nice normal curve, so we can just use mean and standard deviation to adjust the weighting of games. Games in the middle shouldn’t be affected, as they are exactly what is expected, so we’ll say that games within 0.5 standard deviations of the mean are left as is. From there, anything down to -2 or up to +2 standard deviations will be on a linear gradient, and anything outside of that range will be capped at ±0.1. Here’s the same curve with our adjustments overlaid:
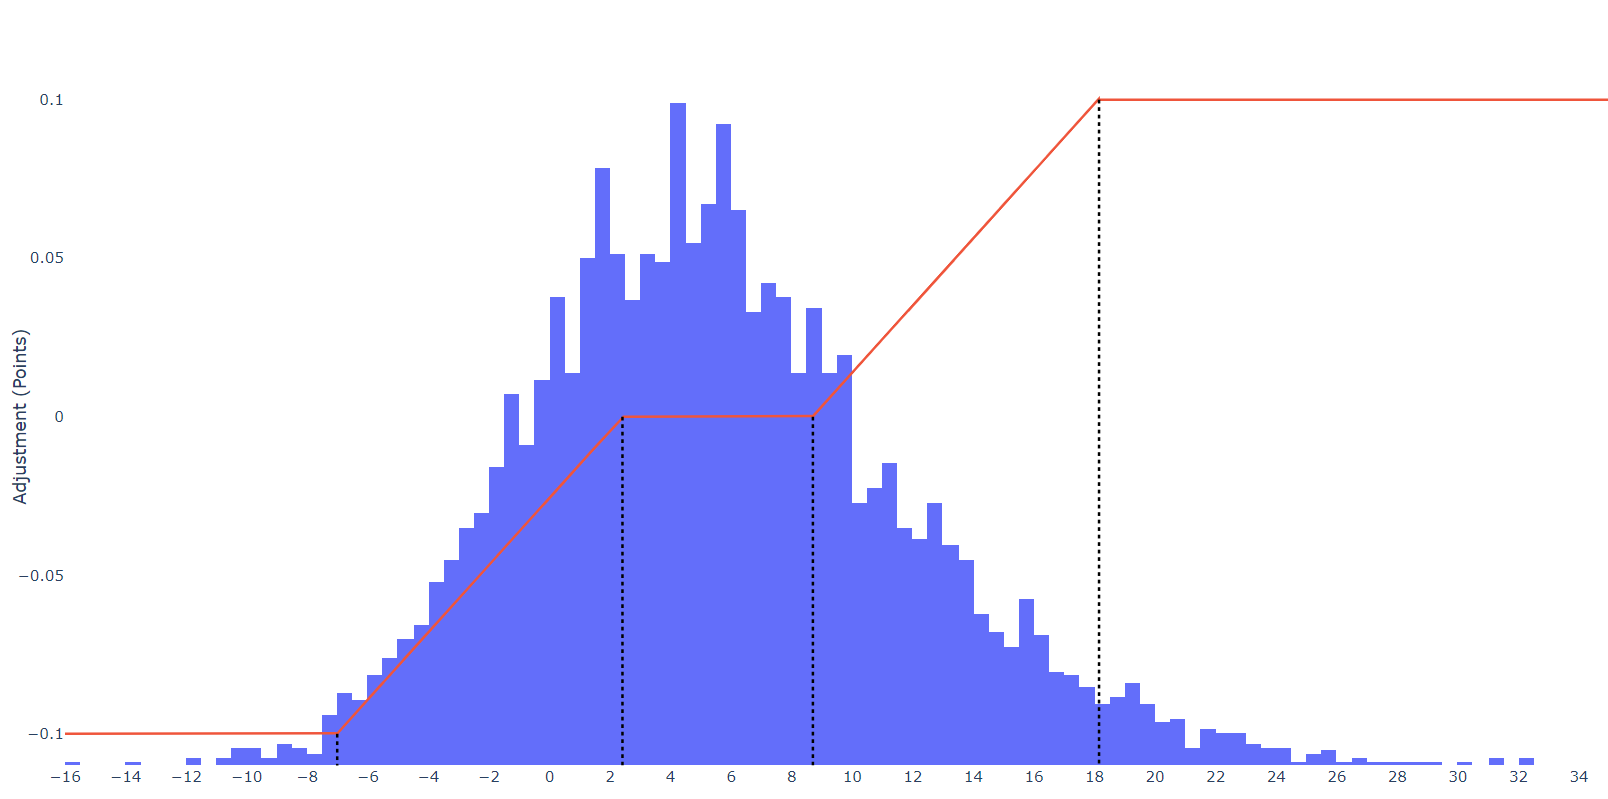
A large portion of games (31%) are unaffected. By coincidence, the slopes of the two lines (0.0106 - full equations in Section IV below) are the same (this isn’t the case if you apply one standard deviation because of the differences in the minimum and maximum compared to the mean). Interestingly, the cutoff points line up pretty well with NFL scoring. For a 0 point adjustment, the lower cutoff is 2.41 and the upper is 8.70. Essentially, if you were up by at least a field goal for the majority of the game, you don’t get penalized. If you were up by more than one score, you get rewarded. Keep in mind that this is based off of the average lead, so while winning by 9 points might not be a lot in its own right, over the whole game, an average lead of 9 points means the game is likely not very close. Maximum points are obtained with an average lead of at least 18.2 (three scores) while the maximum deduction is obtained at an average lead of -7.0 or less (one TD).
Ties will have their own average leads (not necessarily 0), but for simplicity, we can say ties are unaffected by MOV (which makes sense - there is no MOV). This may be something that is worth revisiting at some point, but with the infrequency of ties in the NFL, it won't really affect the results.
Now that we have the adjustments, we can figure out how to scale our numbers. We want to assign 0 to the worst possible season and 1 to the best possible. The worst case scenario for a team is going 0-16 for a grand total of 0 points. The best case scenario is winning all 16 games. This would be 8 homes games (1.15+0.1 = +1.25) and 8 road games (0.85+ 0.1 = +0.95) for a grand total of 17.1. Since points are earned linearly, we can just leave this sum as is (note also that it approximately follows total wins).
$$Wins =\sum_{g \in Games} Pts_g$$where
$$Pts_g = \begin{cases} 1*HFA_{Adj.}+AL_{Adj.} & \text {Win}\\ 0.5*HFA_{Adj.}+AL_{Adj.} & \text{Tie}\\ 0 & \text{Lose} \end{cases}$$ $$ HFA_{Adj.} = \begin{cases} 1.15 & \text{Away}\\ 0.85 & \text{Home} \end{cases} $$ $$ AL_{Adj.} = \begin{cases} -0.1 & {AL \leq -7.01}\\ 0.0106*AL-0.0921 & {-7.01 < AL \leq 2.41}\\ 0 & {2.41 < AL \leq 8.70}\\ 0.0106*AL-0.0256 & {8.70 < AL}\\ \end{cases} $$
$$Wins =\sum_{g \in Games} Pts_g$$
$$Pts_g = \begin{cases} 1*HFA_{Adj.}+AL_{Adj.} & \text {Win}\\ 0.5*HFA_{Adj.}+AL_{Adj.} & \text{Tie}\\ 0 & \text{Lose} \end{cases}$$ $$ HFA_{Adj.} = \begin{cases} 1.15 & \text{Away}\\ 0.85 & \text{Home} \end{cases} $$ $$ AL_{Adj.} = \begin{cases} -0.1 & {AL \leq -7.01}\\ 0.0106*AL-0.0921 & {-7.01 < AL \leq 2.41}\\ 0 & {2.41 < AL \leq 8.70}\\ 0.0106*AL-0.0256 & {8.70 < AL}\\ \end{cases} $$
V. Opponents and Opponents’ Opponents
Now that we have our weighting for a team’s games, we can consider their opponents. We’ll start with opponents’ opponents, because it turns out to be incredibly easy. To see this, let’s look at how the NFL makes it schedule. Every team plays 16 games, with the games split as follows:
- 2 games against each team in your division (6 total)
- 1 game against each team in another division in your conference (4)
- 1 game against each team in another division not in your conference (4)
- 1 game against the same-rated team in the other two divisions in your conference (2)
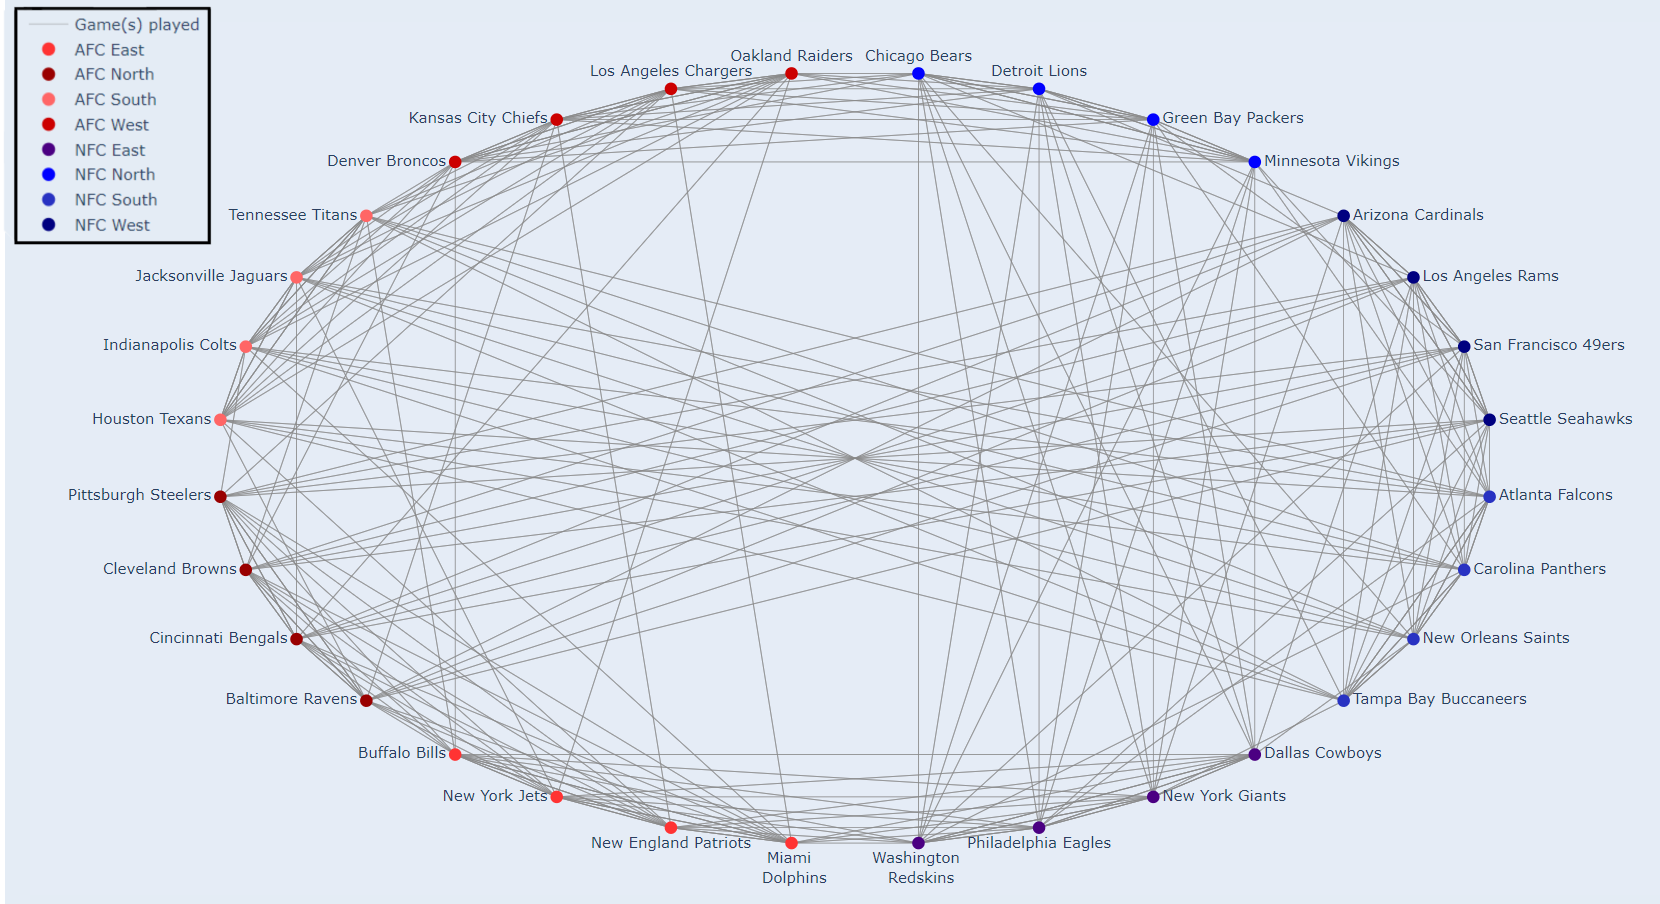
Here's an example connecting the Houston Texans and the Arizona Cardinals. These teams are from different conferences and didn’t play each other in 2019. However, they both played the Atlanta Falcons.
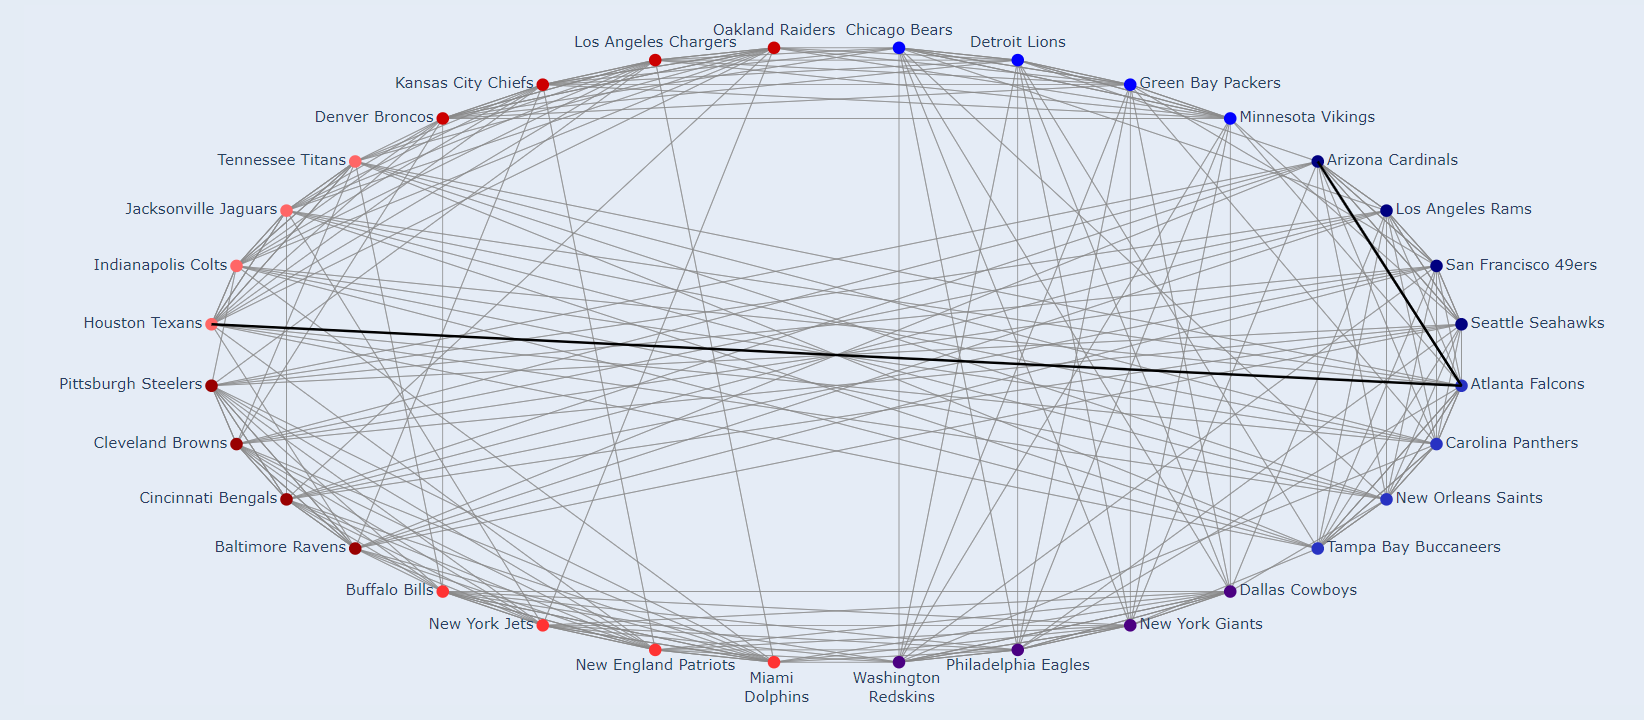
To find a connection for any two teams on an interactive version of this graph, go here. If the website is down or you're interested in how I did this, you can find the github repository behind the dashboard (along with a Jupyter notebook version) here. An important note is that these connections are not necessarily unique (the Texans and Cardinals also connect via the Baltimore Ravens), but this code will always find one such path.
The takeaway from this is that a metric for the win percentage of your opponents' opponents would be meaningless as it would encompass every NFL game, regardless of what team was initially being analyzed. Therefore, we can reduce our points formula to the following:
The takeaway from this is that a metric for the win percentage of your opponents' opponents would be meaningless as it would encompass every NFL game, regardless of what team was initially being analyzed. Therefore, we can reduce our points formula to the following:
$$Points = w_1 * Win\%_{Adj.}+w_2 * Win\%_{Opp.}$$
This just leaves opponents’ win percentage. This calculation is simple: it will just be the game-averaged winning percentage of all of your opponents in all of their games that were not against you. Why are we excluding adjustments for home field advantage and margin of victory? Since each team gets 8 home games and 8 away games, we can assume that the effect of home field advantage gets averaged out among your opponents. Additionally, it makes things a lot easier when we look at games between two of your opponents (more on that shortly). For margin of victory, we want to reward teams for doing well without them having to consider how it may affect other teams. Likewise, we don’t want to set up a scenario where one team can manipulate their playoff position by winning but only by a little. By excluding margin of victory in this step, we are preserving the integrity of the margin of victory adjustment and making it so that a team would never benefit from intentionally handicapping themselves.
Note that our metric has some redundancy built in: the teams in your division will play each other, meaning that your division will give you 6 wins and 6 losses no matter what (even in the case of ties). Similarly, anytime you played two teams that also played each other, you will get 1 win and 1 loss from their game. However, since 2002, this has happened exactly 75 times for each team for each season (out of the 240 games played by opponents not against you). This is also an artifact of the way the league designs its schedule. If you play two teams that play each other, it must be one of three cases:
Note that our metric has some redundancy built in: the teams in your division will play each other, meaning that your division will give you 6 wins and 6 losses no matter what (even in the case of ties). Similarly, anytime you played two teams that also played each other, you will get 1 win and 1 loss from their game. However, since 2002, this has happened exactly 75 times for each team for each season (out of the 240 games played by opponents not against you). This is also an artifact of the way the league designs its schedule. If you play two teams that play each other, it must be one of three cases:
- Both teams are in the same division
- One of the teams is in your division and the other is in a division that your division is paired with for the season
- Both teams were the same placed team from different divisions the year prior and hence they also play each other
$$Win\%_{Opp.} = \left(\sum Opponents'\ Wins\right)*\frac{1}{165-75} - 75*\frac{1}{165-75}$$
This counts your division twice (since you play each member twice), meaning that their games are “more important” than your other opponents. However, this is fair: if you play a 1-15 team twice, your opponents’ winning percentage should reflect this. It doesn’t necessarily matter that it is the same team; all that matter is how good your opponents were.
Now all that’s left to do is figure out the weighting of your win percentage vs. your opponents’.
Now all that’s left to do is figure out the weighting of your win percentage vs. your opponents’.
VI. Weightings
To decide the weighting, we have to decide what we think your opponents’ win percentage should mean. I think that win percentage should be able to push an (x,y) team out and an (x-1, y+1) team in. For instance, a 10-6 team that had a very hard schedule should be in over an 11-5 team with very weak opponents. In other words, opponent’s win percentage can make up one game. It shouldn’t, however, make up two games, all else being equal. There should be no way for an 8-8 team to knock out a 10-6 team, assuming similar win quality. Why this caveat? Because as set, a 12-4 team that obliterates teams in its 12 wins can edge out a 16-0 team that barely wins in all of its games. That may seem extreme, but remember that this is the most extreme scenario. This would look something like the 12-4 team winning by an average of 40 points and the 16-0 team coming back late in every game to win in OT. This likely won’t ever happen, but if it did, I would feel comfortable taking the 12-4 team. Either way, they’ll both make the playoffs.
So if we can figure out the minimum distance between two teams separated by two wins, we can set it so that at most, win percentage makes their total points equivalent. Then we just give the tiebreaker to the team with the most outright wins. So how close can these two teams get? This turns out to be pretty simple. Assuming the same win quality in all wins, the two teams will be separated by at least 1.8 (two extra home wins) and at most 2.2 (two extra away wins). However, we don’t want our 8-8 team beating our 10-6 team, so we take the minimum and say win percentage can add a maximum of 1.8 games to your score. Now, we have our final equation:
So if we can figure out the minimum distance between two teams separated by two wins, we can set it so that at most, win percentage makes their total points equivalent. Then we just give the tiebreaker to the team with the most outright wins. So how close can these two teams get? This turns out to be pretty simple. Assuming the same win quality in all wins, the two teams will be separated by at least 1.8 (two extra home wins) and at most 2.2 (two extra away wins). However, we don’t want our 8-8 team beating our 10-6 team, so we take the minimum and say win percentage can add a maximum of 1.8 games to your score. Now, we have our final equation:
$$Points = \sum_{g\in Games} Pts_g + 1.8*\left[\left(\sum Opponents'\ Wins\right)*\frac{1}{165-75} - 75*\frac{1}{165-75}\right]$$
where $Pts_g$ is defined above and includes HFA and MOV.
Fairly complicated to look at, but the logic behind this equation is straightforward, and the math will all be done by a computer. One downside to this equation is that looking at a team’s schedule doesn’t immediately tell you how that team did. However, looking at a schedule will still give you a general idea of the team’s success. Additionally, this new system simply becomes another number that can be listed with a team’s record and there’s no real reason that the NFL (or the channels broadcasting the NFL) couldn’t add it in.
Now comes the fun part: testing our formula.
VII. Testing
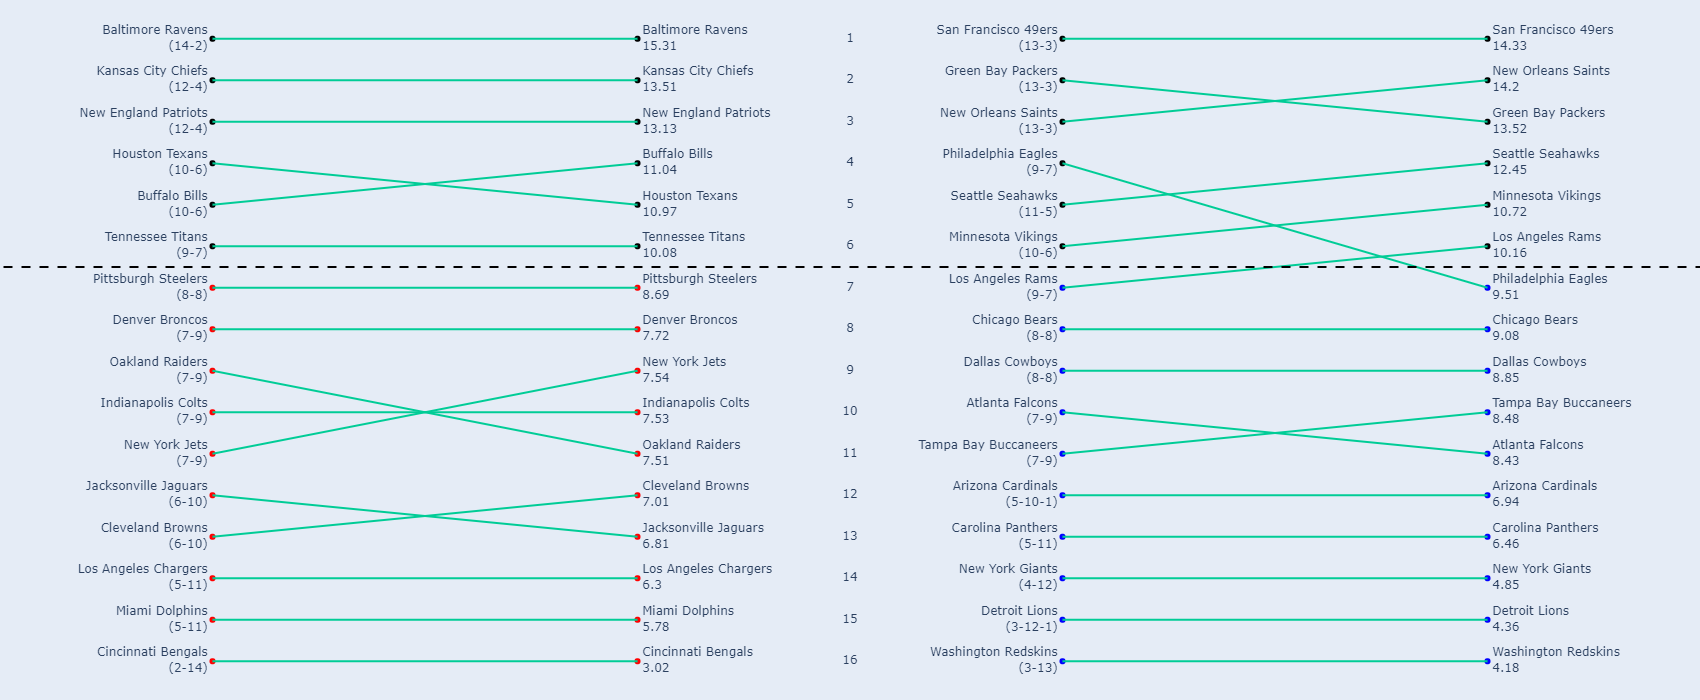
Here are the new standings for 2019 after applying our new metric.
